 |
The amplitude of the sampled signal is a continuous value. Digital systems
represent values using a finite number of bits. Hence the amplitude has to
be approximated and expressed with these finite number of bits. This
processes is called quantization. The quantized values are integer
multiple of a quantity ![]() called the quantization step. An example
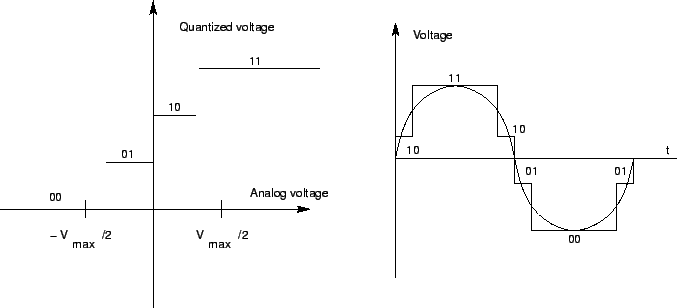
of two bit (or equivalently four level) quantization is shown in
Fig. 8.1. For the quantizer
called the quantization step. An example
of two bit (or equivalently four level) quantization is shown in
Fig. 8.1. For the quantizer
![]() , where
, where
![]() is the maximum voltage (peak-to-peak) that can be expressed
within an error of
is the maximum voltage (peak-to-peak) that can be expressed
within an error of ![]() .
.
 |
Quantization distorts the sampled signal affecting both the amplitude and
spectrum of the signal. This is evident from Fig. 8.1 for
the case of a two bit four level quantized sine wave. The amplitude
distortion can be expressed in terms of an error function
![]() , which is also called the quantization noise.
Here
, which is also called the quantization noise.
Here ![]() is the output of the quantizer. The variance of quantization
noise under certain restricted conditions (such as uniform quantization)
is
is the output of the quantizer. The variance of quantization
noise under certain restricted conditions (such as uniform quantization)
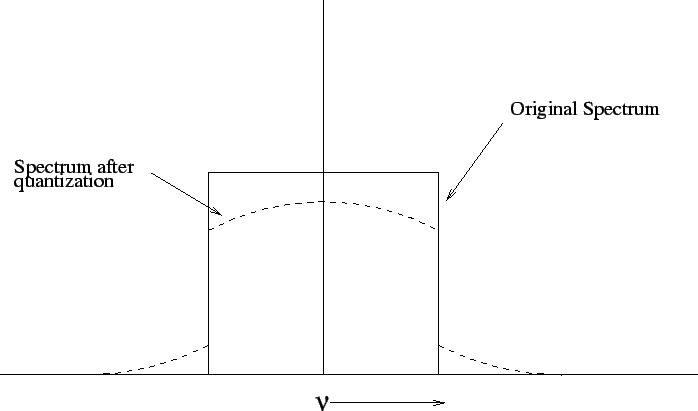
is ![]() . The spectrum of quantization noise extends beyond the
bandwidth
. The spectrum of quantization noise extends beyond the
bandwidth ![]() of
of ![]() (see Fig. 8.2). Sampling at
the Nyquist rate (
(see Fig. 8.2). Sampling at
the Nyquist rate (![]() ) therefore aliases the power of the
quantization noise outside
) therefore aliases the power of the
quantization noise outside ![]() back into the spectral band of
back into the spectral band of ![]() .
For radio astronomy signals, the spectral density of the quantization
noise within
.
For radio astronomy signals, the spectral density of the quantization
noise within ![]() can be considered uniform and is
can be considered uniform and is
![]()
![]() (assuming uniform quantization). Reduction in
quantization noise is hence possible by oversampling
(assuming uniform quantization). Reduction in
quantization noise is hence possible by oversampling ![]() (i.e.
(i.e.
![]() ) since it reduces the aliased power. For example,
the signal to noise ratio of a digital measurement of the correlation function
of s(t) (see Section 8.5) using a Nyquist sampling and a
two bit four level quantizer is 88% of the signal to noise ratio obtained
by doing analog correlation for Nyquist sampling and 94% if one were to
sample at twice the Nyquist rate.
) since it reduces the aliased power. For example,
the signal to noise ratio of a digital measurement of the correlation function
of s(t) (see Section 8.5) using a Nyquist sampling and a
two bit four level quantizer is 88% of the signal to noise ratio obtained
by doing analog correlation for Nyquist sampling and 94% if one were to
sample at twice the Nyquist rate.
The largest value that can be expressed by a quantizer is
determined by the number of bits (![]() ) used for quantization. This
value is
) used for quantization. This
value is ![]() for binary representation. The finite number of bits
puts an upper bound on the amplitude of input voltage that can be expressed
within an error
for binary representation. The finite number of bits
puts an upper bound on the amplitude of input voltage that can be expressed
within an error ![]() . Signals with amplitude above the maximum
value will be `clipped', thus producing further distortion. This distortion
is minimum if the probability of amplitude of the signal exceeding
. Signals with amplitude above the maximum
value will be `clipped', thus producing further distortion. This distortion
is minimum if the probability of amplitude of the signal exceeding
![]() and
and ![]() is less than
is less than ![]() . For a signal with
a gaussian amplitude distribution this means that
. For a signal with
a gaussian amplitude distribution this means that
![]() ,
,
![]() being the standard deviation of
being the standard deviation of ![]() .
.