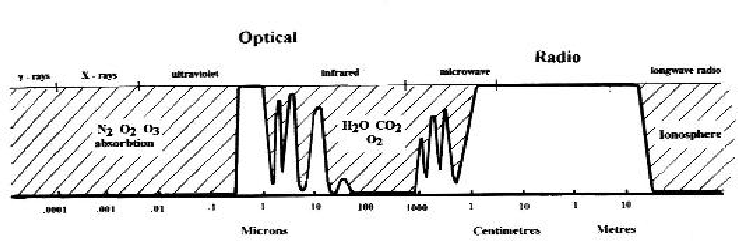
The Figure 1.1 plots the electromagnetic spectrum in terms of the amount of transmission through the earth's atmosphere as a function
of the wavelength. In the figure, shaded areas show
the amount of opacity of the atmosphere at certain wavelengths,
whereas, clear areas show the transparency of the atmosphere at other
wavelengths. As can be seen, there are two prominent bands or windows,
corresponding to the optical and radio wavelengths, through which one can make
observations from the surface of the earth. The radio window covers a much
larger wavelength band than the optical window in the electromagnetic spectrum. Depending
on the atmospheric conditions the width of the radio window may vary, but is
in general from ![]() 1 cm to
1 cm to ![]() 10 m.
10 m.