'rfiserver' is the command to start the application. It has various options which are described below
>> rfiserver [option] [h] [g] [c] [t] [i] [d] [a] [o] [history] [info]
- -h Show Help about 'rfiserver' coomand
- -g rfiserver in GUI mode (Default - command line mode)
- -c GUI based client application for visual purpose for command line mode
- -t Data dumping time in minutes (Default - 24hrs)
- -i Input file path of Spectrum Analyzer Setting (Default - /home/rfiuser/setfiles/defaults.set)
- -d Direction Selection options can be N S W E A (Default - A, All Directions)
- -a Video averaging ON/OFF (Default - 0, OFF)
- -o Output *.RFI file name with path \ (Default - /home/rfiuser/rfidata/*.rfi, Filename is auto generated)
- -history Show command history
- -info Open informational webpage of RFI Monitoring System
1) rfiserver_cmd: - This fully command line application which has no GUI parts. While starting rfiserver -g option is not given, then by default rfiserver application starts in command line mode. For this one has to give at least one option other than -g. This application runs silently, and directly dumps rfi status data in .rfi file. If no input file is given it taken setting file defaults.set which is 0-1500 MHz band with VBW 3 MHz and RBW 3 MHz While running rfiserver in command line mode, if any one wants to monitor see RFI status then he can use rfiserver_client application.
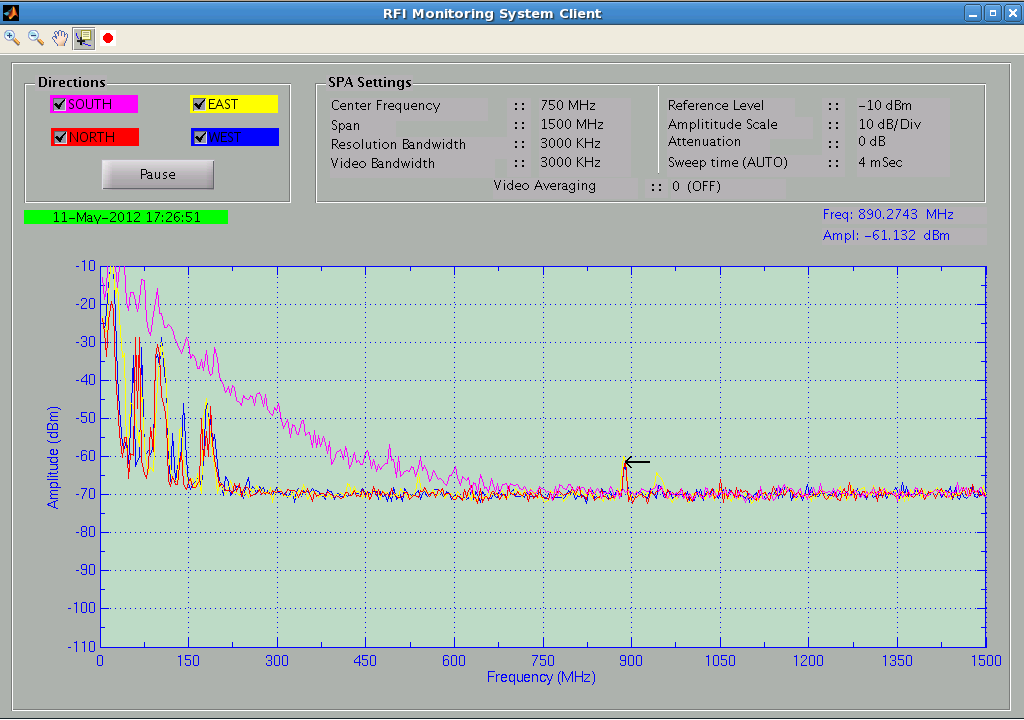
2) rfiserver_client:- This application only shows current RFI status. For this rfiserver application must be started in any mode i.e. GUI or command line mode. To see online status, you have to press start button, then it will show all information of current rfiserver applications status. This tool is optional. This tool does not have any control on RFI Monitoring system's hardware. This tool has advantage of data-point cursor, after selecting data-point cursor it shows Frequency and amplitude any click point on plot.
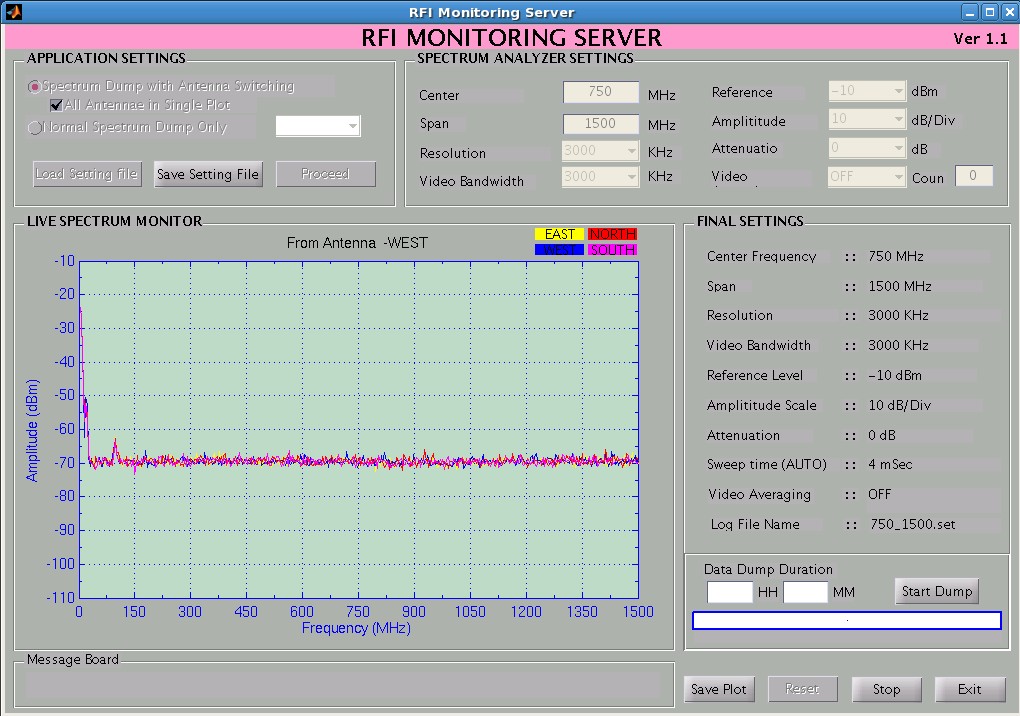
3) rfiserver_gui: - This is GUI based application. By using this one can get *.rfi data of any selected band, custom band or full band (0-1500MHz) with 401 data-points. For preset bands, one can use *.set files to load settings by using Load setting file button. And main advantage of GUI based applications is one can only monitor RFI status all four directions in single plot without dumping RFI data. Here one more facility added to save current plot. Following picture shows the Front GUI panel of RFI Monitoring Server application.