Let
![]() be treated as an independent variable. Then
one can write a 3D Fourier transform of
be treated as an independent variable. Then
one can write a 3D Fourier transform of ![]() with the conjugate
variable for (
with the conjugate
variable for (![]() ) being (
) being (![]() ), as
), as
| (14.2.2) |
| (14.2.3) |
| (14.2.4) |
This equation then provides the connection between the 2D sky
brightness distribution given by ![]() and the result of 3D Fourier
inversion of
and the result of 3D Fourier
inversion of ![]() given by
given by ![]() referred to as the
Image volume.
referred to as the
Image volume.
 |
 |
Hereafter, I would use ![]() to refer to the this Image volume.
to refer to the this Image volume.
In Eq.14.1.1, we have ignored the fringe rotation term ![]() in the exponent. This is done here only for mathematical (and
typing!) convenience. The effect of including this term would be a
shift of the Image volume by one unit in the conjugate axis,
namely
in the exponent. This is done here only for mathematical (and
typing!) convenience. The effect of including this term would be a
shift of the Image volume by one unit in the conjugate axis,
namely ![]() . Hence, the effect of fringe stopping is to make the top
most plane of
. Hence, the effect of fringe stopping is to make the top
most plane of ![]() tangent to the phase center position on the
celestial sphere with the rest of the sphere completely contained
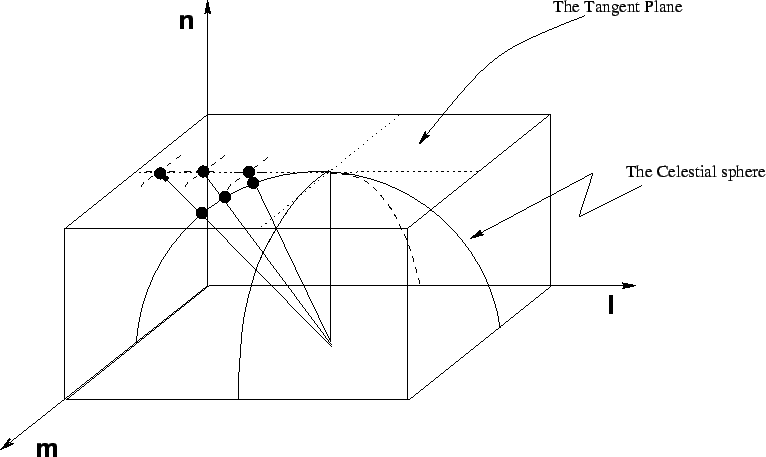
inside the Image volume as shown in Fig. 14.1.
tangent to the phase center position on the
celestial sphere with the rest of the sphere completely contained
inside the Image volume as shown in Fig. 14.1.
Remember that the third variable ![]() of the Image volume is not
an independent variable and is constrained to be
of the Image volume is not
an independent variable and is constrained to be
![]() .
Eq 14.2.6 then gives the physical interpretation of
.
Eq 14.2.6 then gives the physical interpretation of ![]() .
Imagine the celestial sphere defined by
.
Imagine the celestial sphere defined by ![]() enclosed by the Image volume
enclosed by the Image volume ![]() , with the top most plane being tangent to the
celestial sphere as shown in Fig. 14.1.
Eq. 14.2.6 then says that only those parts of the Image
volume correspond to the physical emission which lie on the surface
of the celestial sphere. Note that since the visibility is written as
a function of all the three variables
, with the top most plane being tangent to the
celestial sphere as shown in Fig. 14.1.
Eq. 14.2.6 then says that only those parts of the Image
volume correspond to the physical emission which lie on the surface
of the celestial sphere. Note that since the visibility is written as
a function of all the three variables ![]() , the transfer function
will also be a volume. A little thought will then reveal that
, the transfer function
will also be a volume. A little thought will then reveal that
![]() will be finite away from the surface of the celestial
sphere also, but that would correspond to non-physical emission in the
Image volume due to the side lobes of the telescope transfer
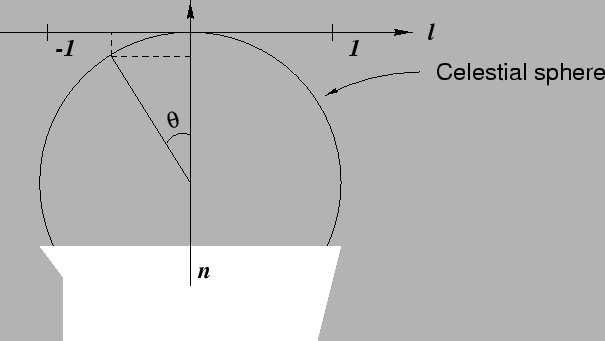
function (referred to by Point spread function (PSF) or Dirty beam in the literature). A 3D deconvolution using the Dirty image- and the Dirty beam-volumes will produce a Clean image-volume. Therefore, after deconvolution, one must perform
an extra operation of projecting all points in the image volume
along the celestial sphere onto the 2D tangent plane to recover the 2D
sky brightness distribution. Fig. 14.2 is the graphical
equivalent of the statements in this paragraph.
will be finite away from the surface of the celestial
sphere also, but that would correspond to non-physical emission in the
Image volume due to the side lobes of the telescope transfer
function (referred to by Point spread function (PSF) or Dirty beam in the literature). A 3D deconvolution using the Dirty image- and the Dirty beam-volumes will produce a Clean image-volume. Therefore, after deconvolution, one must perform
an extra operation of projecting all points in the image volume
along the celestial sphere onto the 2D tangent plane to recover the 2D
sky brightness distribution. Fig. 14.2 is the graphical
equivalent of the statements in this paragraph.