We present plots of flux density (in Jy) as a function of ![]() -distance (in kilo
wavelength) for the 235 MHz GMRT data.
-distance (in kilo
wavelength) for the 235 MHz GMRT data.
The input files used for getting these plots are the final ![]() -data files got from the
'amplitude and phase self calibration'. The AIPS task UVPLT was
used for getting the
-data files got from the
'amplitude and phase self calibration'. The AIPS task UVPLT was
used for getting the ![]() -distance plots using the following parameters : DOCALIB=1;
BCHAN=1; ECHAN=0; BPARM=0 0 1 0 20 0 3 10 1 0. DOCALIB=1 is to apply the
calibration, BPARM(3)=1 is to put fixed scale for X & Y axis, BPARM(4) &
BPARM(5) are used for the fixed scale of X-axis (0 kL to 20 kL). BPARM(7)=3 is to
change the Y axis maximum value to desired one. This value has been changed for each plot as
per the flux density of each source, BPARM(8)=10 is number of bins to be plot,
BPARM(9)=1 is for the values and standard deviations in each bin will be put in the
message file (prio=5); has no effect if the plot is not binned.
-distance plots using the following parameters : DOCALIB=1;
BCHAN=1; ECHAN=0; BPARM=0 0 1 0 20 0 3 10 1 0. DOCALIB=1 is to apply the
calibration, BPARM(3)=1 is to put fixed scale for X & Y axis, BPARM(4) &
BPARM(5) are used for the fixed scale of X-axis (0 kL to 20 kL). BPARM(7)=3 is to
change the Y axis maximum value to desired one. This value has been changed for each plot as
per the flux density of each source, BPARM(8)=10 is number of bins to be plot,
BPARM(9)=1 is for the values and standard deviations in each bin will be put in the
message file (prio=5); has no effect if the plot is not binned.
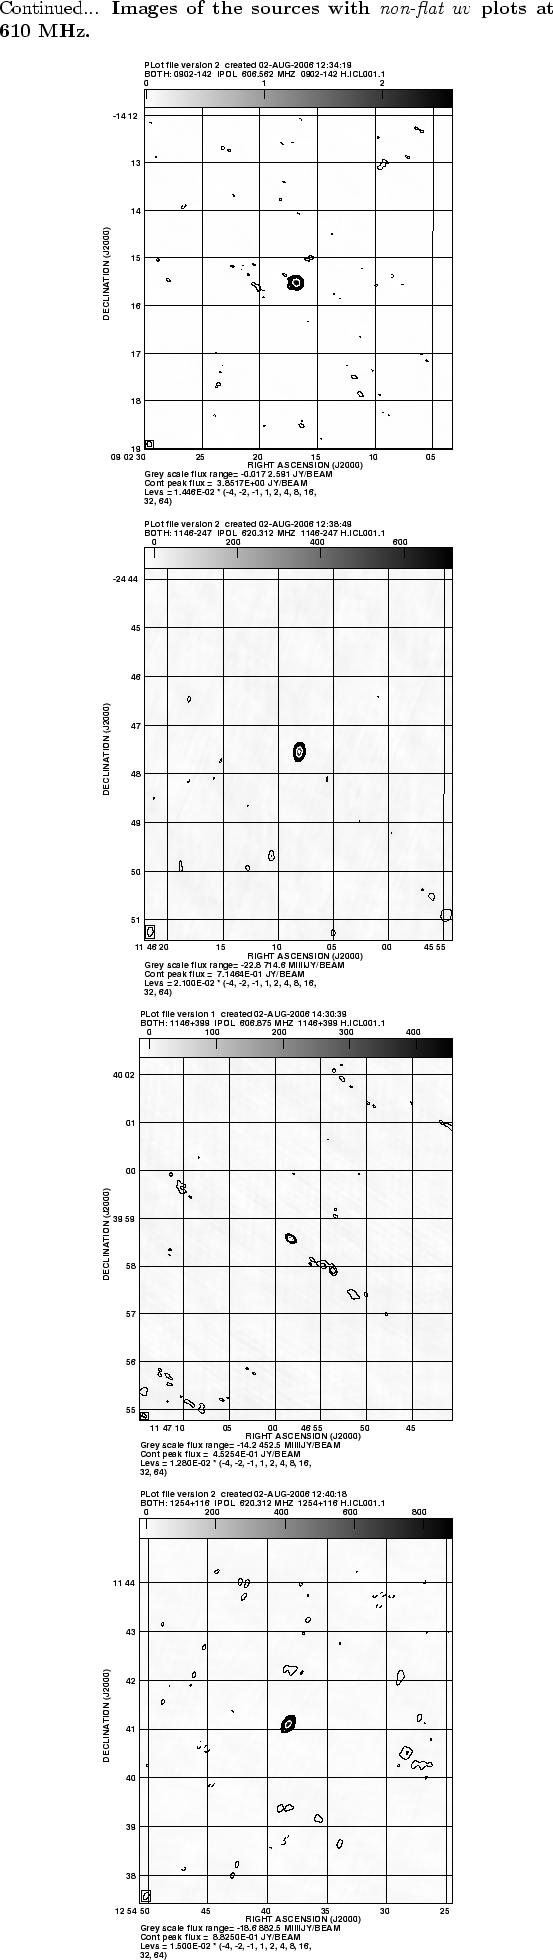
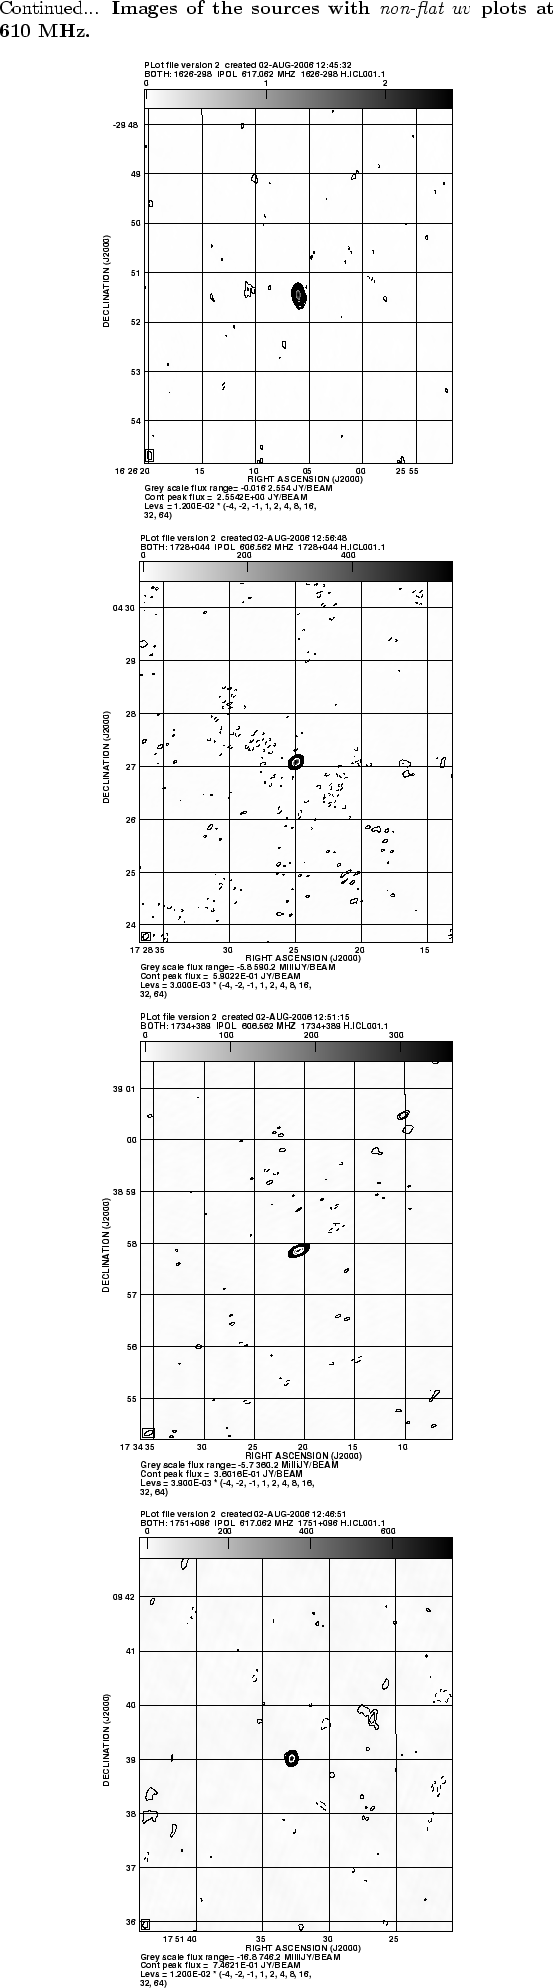
Unlike the case of 610 MHz where most of the sources have flat ![]() -distance plots,
at 235 MHz, the sources have mostly non-flat
-distance plots,
at 235 MHz, the sources have mostly non-flat ![]() -distance plots,
because of several reasons e.g source is resolved on the observed
-distance plots,
because of several reasons e.g source is resolved on the observed ![]() scale, presence
of strong secondary source(s) near the source etc. This behavior was not
unexpected since the source were selected from the 1420 MHz calibrators in VLA
calibration list which are usually compact flat spectrum objects for which there is no
information at low frequencies. Many of them were very found to be weak or non detectable
at 235 MHz and hence could not be considered as calibrators.
scale, presence
of strong secondary source(s) near the source etc. This behavior was not
unexpected since the source were selected from the 1420 MHz calibrators in VLA
calibration list which are usually compact flat spectrum objects for which there is no
information at low frequencies. Many of them were very found to be weak or non detectable
at 235 MHz and hence could not be considered as calibrators.
In figure 4.5, we are presenting ![]() -distance plots for the 21
sources for which flux density (peak as well as integrated flux density) is greater
than 2.5 Jy. For the observing setup at 235 MHz, with 5 minutes of integration,
and 1 MHz bandwidth, the
-distance plots for the 21
sources for which flux density (peak as well as integrated flux density) is greater
than 2.5 Jy. For the observing setup at 235 MHz, with 5 minutes of integration,
and 1 MHz bandwidth, the ![]() noise on a given baseline is of the order of a hundred mJy
and we have chosen the cutoff of 2.5 Jy as the minimum acceptable for a calibrator.
noise on a given baseline is of the order of a hundred mJy
and we have chosen the cutoff of 2.5 Jy as the minimum acceptable for a calibrator.