Analyzing Radio Frequency Interference (RFI) in Upgraded GMRT Raw Voltage Data
The following are the aims of this experiment:
1. To examine and compare the statistical properties of the voltage time series data recorded from the GMRT at bands 3 and 5.
2. To construct a power spectrum and dynamic spectrum from the data.
3. To construct auto-correlation and cross-correlation spectra.
4. Identify RFI in the data at bands 3 and 5.
Pre-requisites:
We recommend knowledge of the following aspects of radio astronomy:
1. A qualitative understanding of how a radio antenna works and how observing in the radio is different from observing in the optical spectrum.
2. Basic understanding of radio receiver elements such as low noise amplifiers, mixers, filters, detectors and integrators and their effect on electrical signals.
3. Basic probability theory and statistics, including knowledge of the Gaussian distribution and the central limit theorem; basics of Fourier transforms.
4. Experience with file handling, data manipulation, and plotting using any programming language appropriate for data analysis.
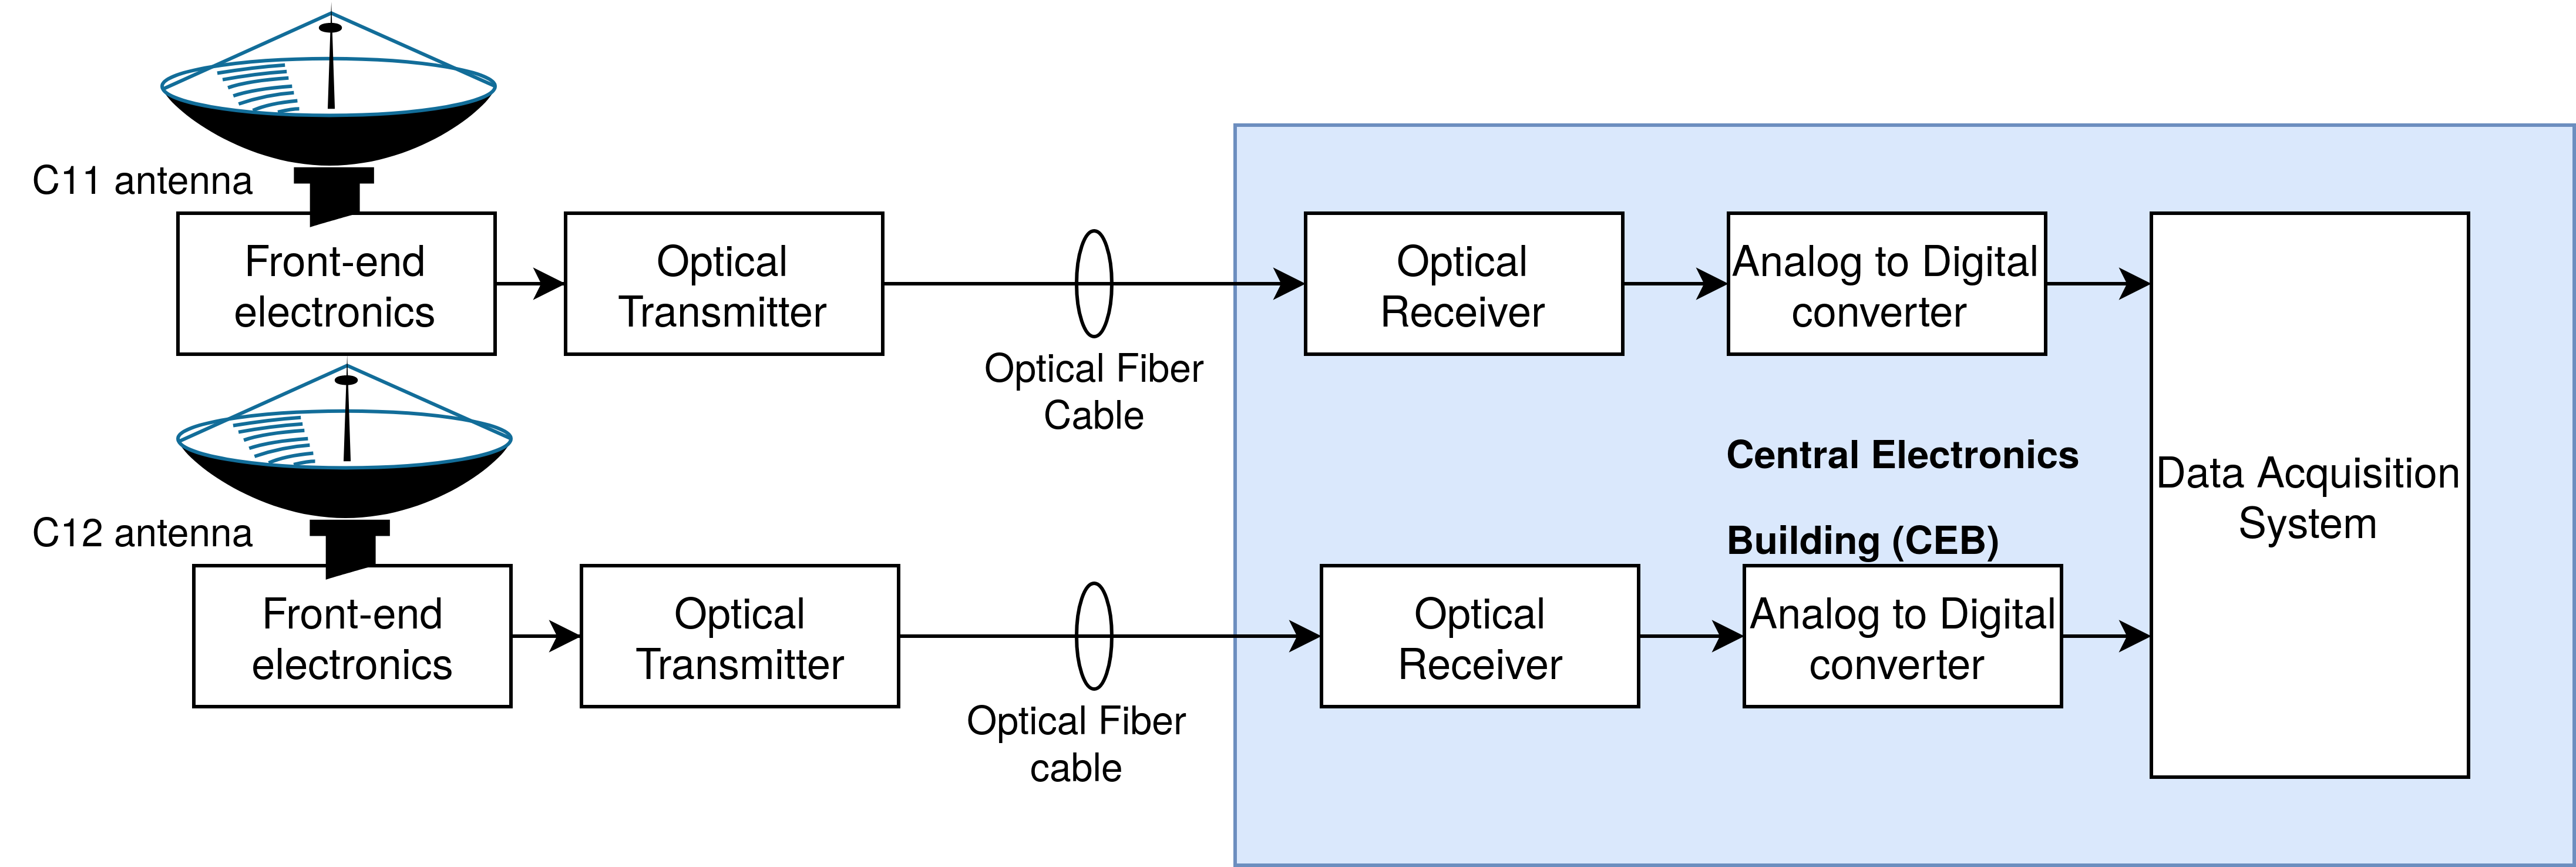 Block diagram showing the receiver chain from which the raw voltage data are acquired.
Instructions and Files:
Refer to the instruction manual for details on the experiment, analysis, and expected outcome.
Python code: Band-3 and Band-5
Data and code
Longer Dataset: ASCII for raw voltage data recorded for C11 and C12 antennas in Band-3 (250-500 MHz) and Band-5 (1000-1450 MHz) is available here.
The presentation of a talk delivered by me at IUCAA Pune on this experiment is provided here.
Expected output from the python code is provided in the instruction manual.
This experiment was developed as part of Radio Astronomy Winter School (RAWS) 2021 by Ruta Kale, Kaushal Buch, and Bela Dixit.
Block diagram showing the receiver chain from which the raw voltage data are acquired.
Instructions and Files:
Refer to the instruction manual for details on the experiment, analysis, and expected outcome.
Python code: Band-3 and Band-5
Data and code
Longer Dataset: ASCII for raw voltage data recorded for C11 and C12 antennas in Band-3 (250-500 MHz) and Band-5 (1000-1450 MHz) is available here.
The presentation of a talk delivered by me at IUCAA Pune on this experiment is provided here.
Expected output from the python code is provided in the instruction manual.
This experiment was developed as part of Radio Astronomy Winter School (RAWS) 2021 by Ruta Kale, Kaushal Buch, and Bela Dixit.