 |
Eq. 9.0.1 for a broadband signal after delay compensation and
integration (time average) can be written as
| (9.2.13) |
| (9.2.14) |
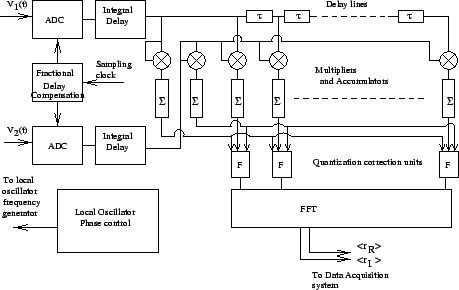
A block diagram of an XF correlator is shown in Fig. 9.5.
In this diagram, fractional delays are compensated for by changing the
phase of the sampling clock. After delay compensation, the cross
correlations for different delay are measured using delay lines and
multipliers, which are followed by integrator. Since the cross correlation
function in general is not an even function of ![]() , the delay compensation
is done such that the correlation function is measured for both positive
and negative values of
, the delay compensation
is done such that the correlation function is measured for both positive
and negative values of ![]() in the correlator. The zero lag
autocorrelations of the signals are also measured, which is used to
normalize the cross correlation. The quantization correction (block marked
as F) is then applied to the normalized cross correlations. The cross
spectrum is obtained by performing a DFT on the corrected cross correlation
function. A peculiarity of this implementation is that the correlations are
measured first and the Fourier Transform is taken later to get the spectral
information. Hence it is called an XF correlator.
in the correlator. The zero lag
autocorrelations of the signals are also measured, which is used to
normalize the cross correlation. The quantization correction (block marked
as F) is then applied to the normalized cross correlations. The cross
spectrum is obtained by performing a DFT on the corrected cross correlation
function. A peculiarity of this implementation is that the correlations are
measured first and the Fourier Transform is taken later to get the spectral
information. Hence it is called an XF correlator.